24.7%
2023
20.9%
2024
ROAE
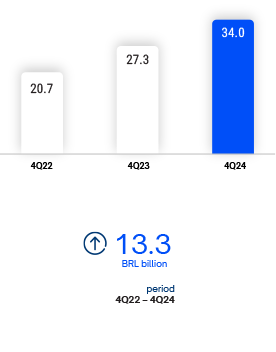
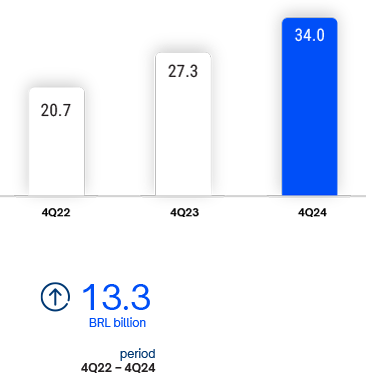
27.3
2023
34.0
2024
Total Assets
BRL billion
14.8%
2023
14.7%
2024
Basel Ratio
Total Assets
BRL billion
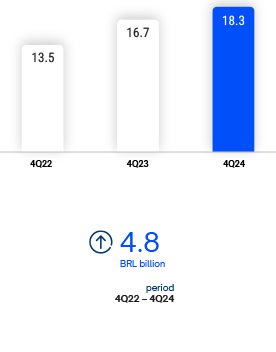
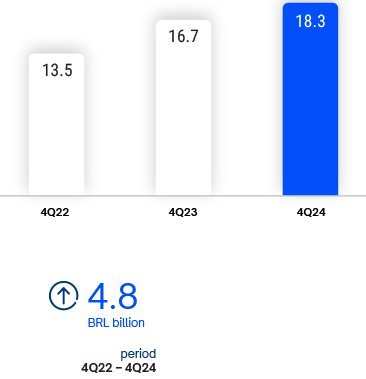
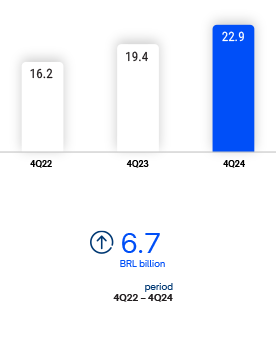
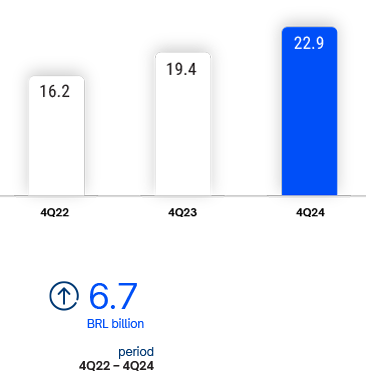
Total Expanded Credit Portfolio
BRL billion
Total Funding
BRL billion
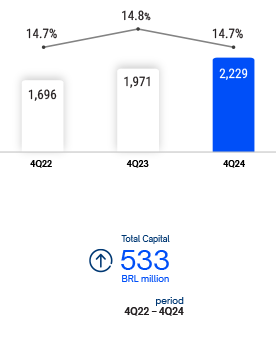
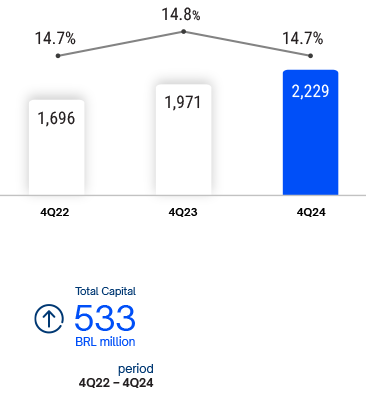
Basel Ratio (%) + Total Capital
BRL million
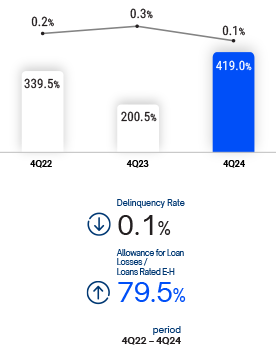
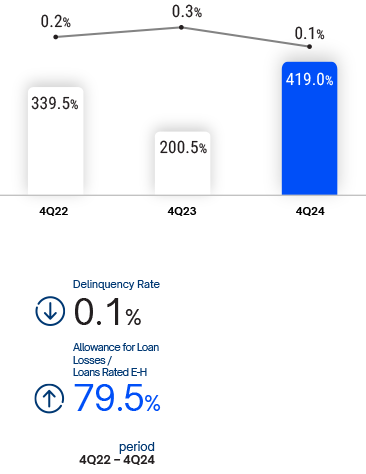
Delinquency Rate + Allowance for Loan Losses / Loans Rated E-H
Revenue Not to Linked Credit
5.5
2023
7.7
2024
Derivatives Volume
BRL billion
2.3
2023
4.1
2024
DCM
BRL billion
2.3
2023
3.3
2024
Assets under Management
BRL billion
BRL million
| 4Q21 | 4Q22 | 4Q23 | 4Q24 | |
|---|---|---|---|---|
| Total Assets | 14,184 | 20,738 | 27,328 | 34,006 |
| Liquid Assets | 2,154 | 3,712 | 5,008 | 6,685 |
| Total Expanded Credit Portfolio¹ | 10,327 | 13,542 | 16,691 | 18,349 |
| E-H / Expanded Credit Portfolio | 0.3% | 0.2% | 0.3% | 0.1% |
| Allowances for Loan Losses/ E-H | 245.9% | 339.5% | 200.5% | 419.0% |
| Total Funding | 11,008 | 16,233 | 19,429 | 22,958 |
| Shareholders' Equity | 841 | 1,010 | 1,210 | 1,394 |
| Tier I | 1,013 | 1,185 | 1,379 | 1,557 |
| Basel Ratio | 12.6% | 14.7% | 14.8% | 14.7% |
| Return on Average Equity (p.a.) | 18.4% | 23.8% | 24.7% | 20.9% |
| Return on Average Assets (p.a.) | 1.1% | 1.3% | 1.1% | 0.9% |
| Net Income | 147 | 221 | 274 | 273 |
| Net Income before Tax | 265 | 382 | 464 | 463 |
| Expanded NIM (before Allowances for Loan Losses) ² ³ (p.a.) | 4.6% | 4.8% | 4.1% | 3.3% |
| Efficiency Ratio (ER) | 48.3% | 43.5% | 41.9% | 43.0% |
| Service Revenues | 139 | 158 | 147 | 158 |
| Service Revenues (% of the Total Revenues) ⁴ | 24.6% | 21.3% | 16.8% | 17.7% |
| National Scale | Global Scale | ||
|---|---|---|---|
| Local Currency | Local Currency | Foreign Currency | |
| Moody's | AAA.br | Baa3 | Baa3 |
| Fitch | AAA(bra) | BBB- | BB+ |